18 Proven Advertising Metrics To Track For Digital Marketing

When defining the advertising metrics that spell success, business guru H.J. Harrington says it best, "If you can't measure something, you can't understand it. If you can't understand it, you can't control it. If you can't control it, you can't improve it."
Digital advertising campaign success depends on tracking and optimizing key performance metrics in real time. The right data helps advertisers refine strategies, improve engagement, and maximize ad revenue.
In this guide, you’ll learn how to gain a competitive edge by mastering:
- Why Advertising Performance Metrics Matter
- 18 Ad Metrics To Track For Digital Advertising Success
- How To Improve Ad Performance

Why Advertising Performance Metrics Are Important
There isn’t always a “we’ll get it right next time” in digital advertising. Capturing users' hearts, minds, and wallets is a moving target you don’t want to miss. Thankfully, tracking advertising performance metrics has never been easier, with sophisticated dashboards providing real-time insights throughout your campaign. However, it’s not just about collecting data; it’s about interpreting it to optimize spending and improve ROI. Understanding key metrics helps marketers make informed data-driven decisions, refine strategies, and drive better results, avoiding guesswork and inefficiencies.
18 Ad Metrics To Track For Digital Advertising.png?width=461&height=297&name=Graphic%20A%20(2).png)
To run a successful digital advertising campaign, tracking multiple metrics is crucial. A broader picture of ad performance emerges by tracking various metrics that factor in aspects like ad types, cost per lead, demographics, audience engagement, and financial returns. Each metric provides insights that help advertisers fine-tune campaigns, maximize effectiveness, and increase conversions. Advertising metrics follow a funnel-like structure, starting with broad exposure at the top with metrics like impressions and CPMs and then narrowing down to conversions, cost per leads, and ROI-focused indicators at the bottom.
For example, a user may see a programmatic video ad but not convert immediately. However, if the content is engaging, the brand remains top-of-mind, leading the user to search for the product later and convert through another channel. By tracking and analyzing these interactions, advertisers can refine their approach and achieve better results.
Below are 18 key advertising performance metrics to monitor.
1. Impressions
An impression is the number of times an ad was displayed on a website, app, or social media platform. It does not guarantee that users saw or engaged with the ad—only that it was served.
How it’s calculated: If an ad appears 100,000 times across different devices, the campaign registers 100,000 impressions.
Why it matters:
- A high number of impressions suggests strong reach, but low engagement may signal poor targeting or weak creative
- Decreasing impressions over time can suggest ad fatigue or increased competition
- Helps advertisers analyze CPM efficiency
Analyzing impressions will impact and shape digital advertising strategies, offering intel on ad success. Knowing an advertising campaign's impressions impacts several digital advertising metrics.
2. Cost Per Thousand (CPM)
CPM measures the cost per 1,000 ad impressions and helps advertisers gauge the efficiency of their ad spend. This is significant for publishers and advertisers who approach CPM from opposite directions.
Why it matters:
- Advertisers aim for a lower CPM to maximize reach
- Publishers seek a higher CPM to increase revenue
- A high CPM with low engagement may indicate ineffective ad placement
How it’s calculated: CPM = (Total Ad Spend ÷ Total Impressions) × 1,000
For example, a publisher receiving 5 million impressions with an average CPM of $3.50 would generate $17,500 in revenue.
Monitoring CPM helps advertisers evaluate cost-effectiveness and optimize bidding strategies.
3. Return On Ad Spend (ROAS)
Keep the ROAS metric in your campaign KPIs, as it is one of the most critical metrics for advertisers, measuring the revenue generated for every dollar spent on advertising. In general, a high ROAS indicates a campaign is delivering strong financial performance, while a lower ROAS may signal inefficiencies in targeting, messaging, or ad placement.
How ROAS is Calculated:
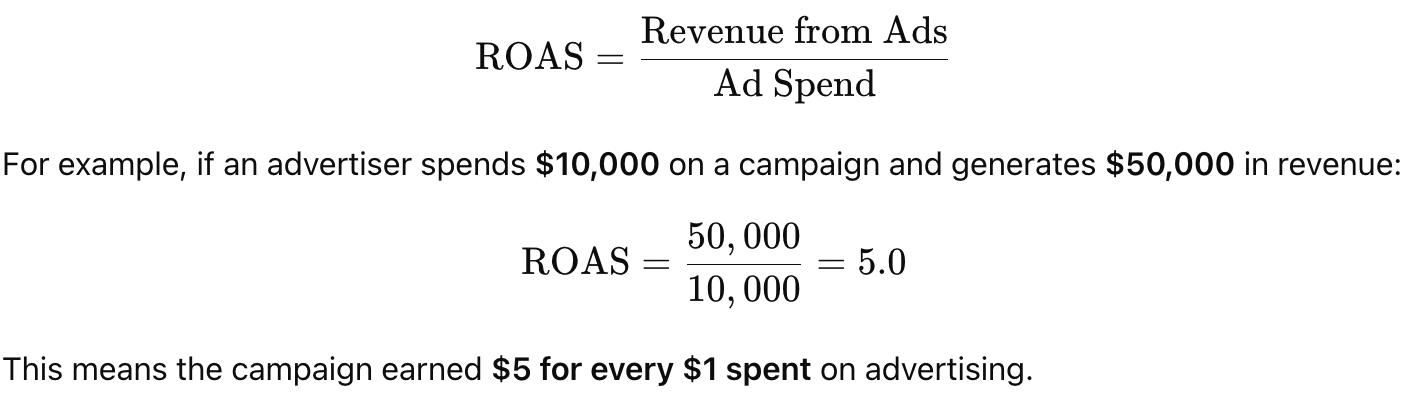
Why ROAS Matters: It is a direct indicator of campaign profitability and helps advertisers:
- Optimize budget allocation – Shift spend toward high-performing channels
- Evaluate ad creatives – Identify which messaging and visuals drive conversions
- Refine audience targeting – Ensure ads reach the most engaged and high-value users
- Compare marketing channels – Determine which platforms (e.g., search, social, display, CTV) deliver the best returns
What Is a “Good” ROAS? It varies by industry, ad format, and business goals. General benchmarks:
- eCommerce: 3:1 to 4:1 (i.e., $3-$4 revenue per $1 spent)
- Brand Awareness Campaigns: Lower ROAS is expected, as the goal is long-term brand equity rather than immediate conversions.
How to Improve ROAS? Refine audience targeting, enhance ad creatives, leverage retargeting, optimize landing pages, or use multi-touch attribution, to name a few.
ROAS is a key performance indicator that directly ties ad spend to business impact, making it one of the most valuable metrics for performance-driven advertisers.

4. Return On Investment (ROI)
Marketing budgets are under constant scrutiny, and proving a strong ROI is key to justifying ad spend. ROI measures how much profit is generated relative to marketing costs, ensuring that every dollar spent contributes to business growth. The goal? A positive ROI, meaning your campaigns are driving more revenue than they cost.
How it is calculated: ROI = (Profit / Total Costs) × 100%
Why ROI Matters:
- Justify marketing budgets with data-backed performance results
- Shift resources toward high-performing campaigns
- Identify underperforming strategies before they drain resources
- Improve efficiency by testing and optimizing ad spend
Proving strong ROI on marketing efforts helps keep budgets strong and profits high. If your ROI is lackluster, consider prioritizing high-performing channels and taking action to improve ad performance across your marketing strategies. Learn more about how to calculate your digital marketing ROI in our blog here.
5. Cost Per Click (CPC)
When you bid, you pay for each click on your ads, ensuring that advertisers only pay for user engagement. You can place a minimum or max on your bid to suit budget or marketing goals. It is a low-risk way to test ads or ensure ad budgets remain targeted on results.
How it’s calculated: CPC = Total Ad Spend ÷ Total Clicks
For example, an organic dog food brand sets a $400 budget for 2,000 clicks, making their CPC $0.20.
Why does it matter to track CPC? Advertisers can optimize spending by only paying for ads that attract users to click for better ROI. The metric helps gauge targeting efficiency, i.e., lower CPC = more efficient ad spending. High CPC may indicate poor audience targeting or weak ad copy.

6. Click-Through Rate (CTR)
This metric tracks the percentage of an ad’s impression that received a click. It tells you, namely, that your customers or prospects are engaged with your call to actions and clicked for more. CTR measures the percentage of users who click on an ad after seeing it.
How it’s calculated: CTR = (Total Clicks ÷ Total Impressions) × 100
For example, an ad with 500 clicks and 10,000 impressions has a CTR of 5%.
Why it matters:
- A high CTR suggests effective targeting and messaging
- A low CTR may indicate the need for ad optimization

7. Viewability Rate
Ad viewability in digital advertising measures how much of an ad is actually seen by users and for how long. It indicates whether an ad appears within the user’s view on a site or device. To be considered viewable, an ad must meet the industry standard set by the IAB in 2014:
- For display ads at least 50% of your display must be visible to consumers for a minimum of 1 second and large display ads require at least 30% visible pixels
- For video ads at least 50% of the video must be visible on the screen and play continuously for at least 2 seconds
How it’s calculated: Viewability Rate = (Viewable Impressions ÷ Measured Impressions) × 100
For example, if a campaign delivers 100 million impressions but only 93 million are viewable, the viewability rate is 93%.
Why it matters:
- Ensures that ads are actually seen by users
- Helps optimize ad placements for better performance
Advertisers use this metric to link viewability rate with industry viewability benchmarks to measure the campaign’s ad placement effectiveness.

8. Ad Recall Lift
Ad recall lift measures the increase in brand or ad recognition after exposure to an ad. This metric is crucial for branding campaigns where awareness and message retention are key objectives.
How It’s Measured: Ad recall lift is typically tracked through surveys or analytics tools that compare responses from two groups:
- Exposed Group – Users who saw the ad
- Control Group – Users who did not see the ad
Formula for Ad Recall Lift: Ad Recall Lift is calculated by subtracting the percentage of people who remember seeing the ad in a control group from the percentage of people who recall it in an exposed group. This difference shows how much the ad impacted awareness.
Why It Matters:
Higher recall is linked to strong branding, emotionally resonant storytelling, and visually distinctive ads. For instance, Slack’s "Work Better Together" campaign used vibrant animations and relatable workplace scenarios to make its message memorable.
How to Improve Ad Recall Lift:
- Use bold visuals and consistent branding
- Keep messaging concise and emotionally engaging
- Leverage repetitive exposure across multiple touchpoints
Tracking this metric helps advertisers refine creative strategies and optimize campaigns for stronger brand awareness.

9. Video Completion Rate (VCR)
VCR, or video completion rate, is defined as the percentage of users who watch a video ad to the end. Per the Interactive Advertising Bureau (IAB), a good industry standard for video completion rate ranges between 70%-80% for most online video ads.
How it’s calculated: VCR = (Completed Views ÷ Total Views) × 100
Why it matters:
- Low VCR may signal weak content, messaging, or poor targeting
- High VCR suggests strong audience engagement
Use the metric to analyze and optimize campaign performance for more impactful results.
10. Cost Per View (CPV)
CPV is a pricing model that measures video ad performance based on how much an advertiser pays per view. Every time a user views a video ad on a website, online platform, and device, the advertiser pays the publisher for each view of their video ad. The advertiser pays according to the bid amount chosen. Once the engagement is gauged, the bid amount can be adjusted up or down accordingly.
How it’s calculated: CPV = Total Ad Spend ÷ Total Views
For example, if an advertiser spends $1,000 on a video campaign and receives 5,000 views, the CPV would be $0.20.
Why it matters:
- A low CPV indicates that viewers are actively watching the video, signifying higher audience engagement
CPV is primarily used for video ads, where it provides insight into how well the audience is interacting with the content.
11. Cost Per Engagement (CPE)
CPE tracks when a user interacts with an ad and takes a specific and desired action to ensure that ad costs produce results, such as likes, shares, comments, or poll participation.
How it’s calculated:
CPE = Total Ad Spend ÷ Total Engagements
For example, if a brand runs an interactive poll campaign and pays $500 for 5,000 engagements, their CPE is $0.10.
Why it matters:
- Helps measure audience interest and interaction
- Can inform budget adjustments for better engagement ROI
CPE ads are used in various campaigns, encouraging interaction like taking a poll, and paying only for actions that matter.
12. Lifetime Value (LTV)
Shifting slightly, LTV looks at the customer and estimates the average revenue expected to be generated from a customer over time. A high LTV means customers generate more revenue, justifying higher acquisition costs and improving profitability.
How it’s calculated: LTV= Average Purchase Value × Purchase Frequency × Customer Lifespan
Example: A subscription business charges $50/month, with customers staying for 36 months.
50 × 1 × 36 = 1,800
Each customer is worth $1,800 over their lifetime.
Why It Matters:
- Helps set ad budgets based on customer value
- Justifies acquisition costs by focusing on retention
- Encourages upselling and loyalty strategies
Boosting LTV means higher profitability and sustainable growth. Brands that focus on retention and engagement maximize their long-term success.
13. Cost Per Lead (CPL)
CPL tracks what the advertiser pays for each lead generated. Understanding CPL gives you concrete spending on generating new leads. It can provide insight into other tracked metrics like ROI or CLR calculations. This is a key metric for B2B, SaaS, and lead-generation campaigns, helping businesses evaluate ad spend efficiency and optimize marketing efforts.
How it’s calculated:
Example: If a company spends $5,000 on ads and generates 500 leads, the CPL is:
5,000 ÷ 500 = 10
This means each lead costs $10 to acquire.
Why It Matters:
- Budget Optimization: Helps allocate spending to the most cost-effective channels
- Sales Alignment: Ensures marketing is delivering leads at a sustainable cost
- Profitability Insight: Lower CPL can improve overall return on ad spend (ROAS) and a high CPL can shorten the campaign length due to cost
By continuously monitoring CPL, advertisers can refine targeting, creative, and bidding strategies to maximize lead quality while keeping acquisition costs in check.
14. Customer Acquisition Cost (CAC)
The customer acquisition cost metric provides insight into the effectiveness of digital marketing strategies and the profitability of the customer base. To calculate CAC, divide the total marketing expenses by the number of new customers acquired within a specific period. The goal is to acquire cost-effectively for profitability and sustainable growth. A good target for customer acquisition is 5-8% of your total budget.
Why It Matters:
- Helps optimize budgets for sustainable growth
- Provides insight into marketing efficiency
- Varies by industry, so benchmarking is key
CAC measures how much it costs to acquire a new customer, helping assess marketing efficiency and profitability.
15. Cost Per Acquisition (CPA)
You can get more granular with CPA and track the cost of acquiring a paying customer at a campaign or channel level, offering a more granular view than CAC.
To calculate CPA, divide the total campaign cost by the number of new customers acquired.
Why It Matters:
- Evaluates the efficiency of specific campaigns
- Helps refine targeting and budget allocation
- Lower CPA signals better ROI
It tracks beyond a single conversion, from first visit to customer.
16. Engagement Rate (ER)
Engagement Rate looks at how many users interacted with specific content through likes, shares, comments, or clicks, indicating content relevance and audience interest.
ER is calculated by dividing the total number of interactions by the total number of followers or viewers. This result is then multiplied by 100 to express it as a percentage.
Why It Matters:
- Higher ER means stronger audience engagement
- Drives brand awareness and customer loyalty
- Helps optimize content for better performance
17. Conversion Rate (CVR)
CVR evaluates the percentage of users who complete a desired action, such as a purchase, sign-up, or download. Higher conversion rates equal higher engagement and potential purchases.
To calculate, CVR = (Total Conversions ÷ Total Clicks) × 100
A higher CVR indicates that the ad, landing page, or offer is effectively driving user actions.
18. Cross-Device Conversions
Cross-device conversions (CDC) track when users click an ad on one device but complete the conversion on another, revealing multi-device shopping behaviors. Take a shopper adding a birthday gift to their Etsy shopping cart while riding the train home. Later, they purchase the gift on their tablet at home. Advertisers track CDC to reveal how and where customers interact with digital channels throughout their journey.
Why It Matters:
- Provides a more accurate view of the customer journey
- Prevents underreporting conversions across devices
- Helps improve cross-channel marketing strategies
How To Improve Ad Performance
Enhancing digital ad performance starts with analyzing key metrics and adjusting strategies accordingly. From refining messaging to testing different ad formats, small optimizations can lead to significant improvements. Verifying targeting, adjusting budgets, optimizing keywords, and experimenting with ad placements all contribute to stronger engagement and conversions.
One of the most effective ways to maximize results is through programmatic advertising, which automates the buying, selling, and placement of ads in real-time. By leveraging data-driven insights, programmatic ensures ads reach the right audience at the right time—boosting efficiency, reducing wasted spend, and improving overall campaign success.
Optimize Your Digital Ad Performance With Next Millennium’s Programmatic Advertising
Monitoring ad performance is just the first step—turning insights into action is what drives real results. Many marketers struggle to analyze and optimize campaigns at scale, especially when managing multiple campaigns. That’s where the right ad partner makes all the difference.
At Next Millennium, we go beyond tracking metrics. We take the time to understand your challenges and apply data-driven strategies to boost revenue, enhance user engagement, and achieve campaign goals. Whether it’s refining your approach or leveraging advanced programmatic solutions, our expertise keeps you ahead in the digital ad space.
But don’t just take our word for it—hear from our programmatic clients. Don’t settle for average ad performance. Book a discovery call today!


-1.png?width=520&height=294&name=Blog%20Hero%20images%20(1)-1.png)